Before you start
5- A working Spring Boot web application that you can build and start locally
- Maven or Gradle as your build tool
- A terminal with curl
- Permission to change the application's build file and its application.properties or application.yaml
- Optional: a Prometheus server, only if you want to scrape the metrics later
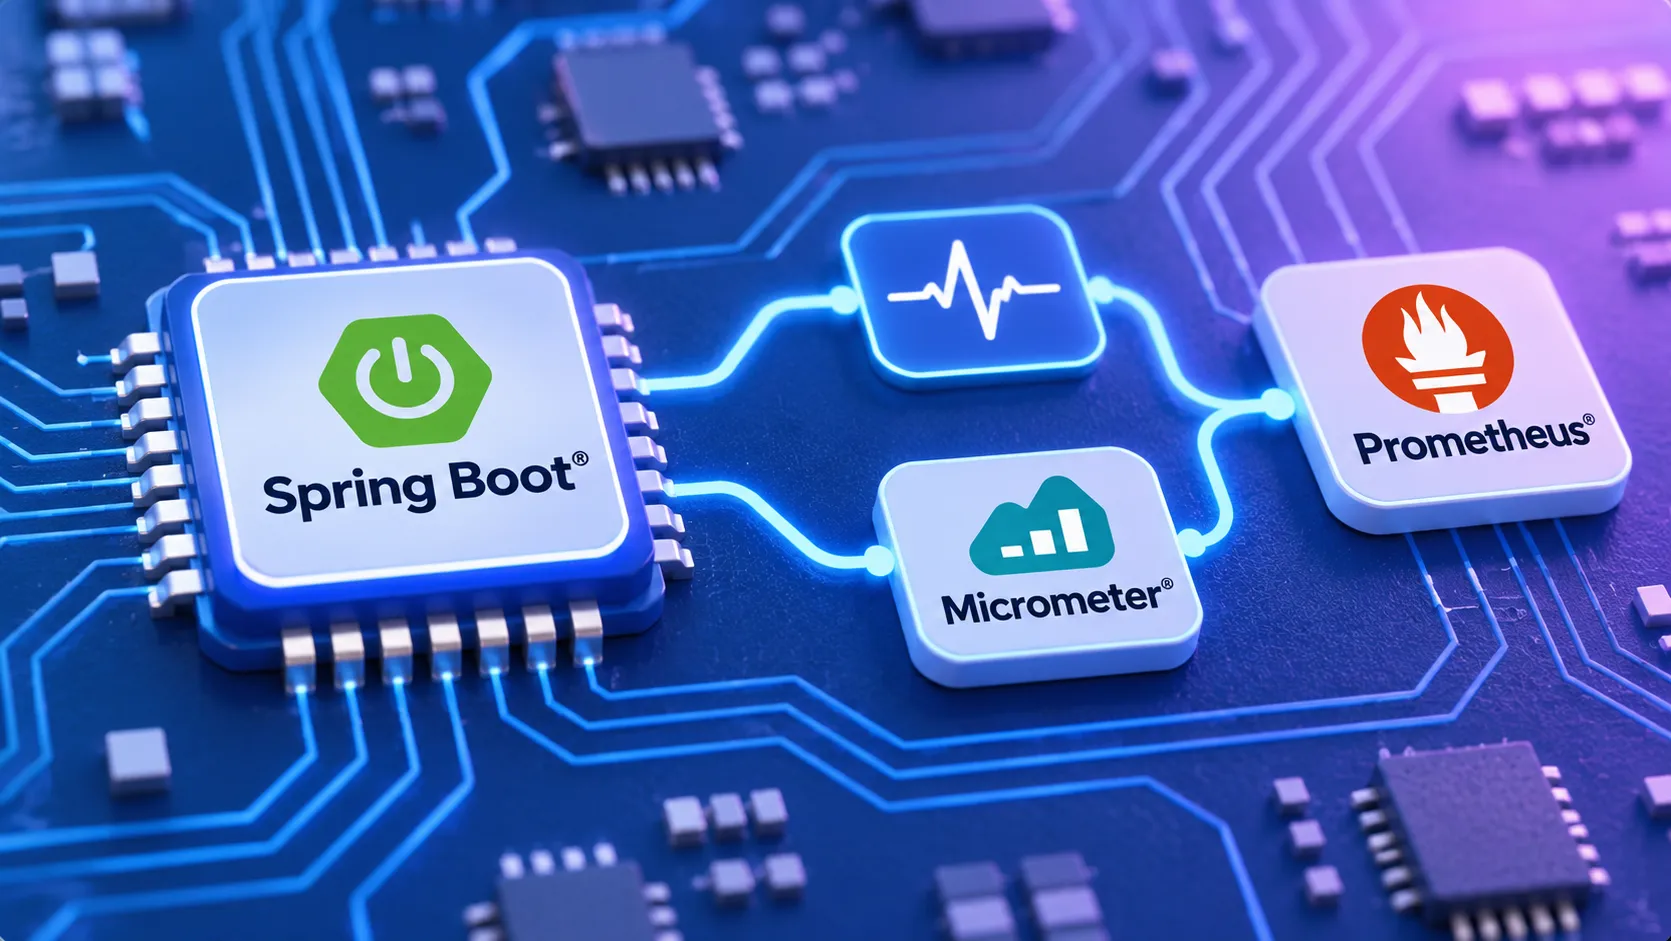
Spring Boot Actuator lets you monitor and interact with a running application. It ships built-in endpoints, and the health endpoint is the best known: it provides basic application health information. Micrometer is the metrics facade that Actuator configures for you. It supports numerous monitoring systems.
This guide connects your app to both. You will decide which endpoints may be used, call the health endpoint, add a Micrometer registry for Prometheus, tag every metric with a common tag and record your own counter.
Versions. No version number is pinned here. Use the Spring Boot version your project already uses. Spring Boot Actuator provides dependency management for Micrometer, so you normally do not set a Micrometer version yourself. If you also declare the Micrometer BOM, you only declare it once per project. If your framework already manages Micrometer versions, defer to that.
Access and permissions in one sentence. An endpoint is available when access to it is permitted and it is exposed. Auto-configuration only creates the built-in endpoints that are available.
What this guide does not cover. The pages used here describe endpoint access and exposure, but they do not describe how to put authentication in front of HTTP endpoints. They also do not give the Actuator dependency coordinates or the full name of the exposure property. For those, follow the links to the official Actuator reference in the references list and check the page for your Spring Boot version.
By default, access to every endpoint except shutdown and heapdump is unrestricted. Most applications choose exposure over HTTP, where the endpoint ID with a prefix of /actuator is mapped to a URL. For example, health is mapped to /actuator/health.
Step 1 of 11: Add the Actuator dependency to your build
Add the Spring Boot Actuator dependency to your project. Without it, no /actuator endpoints exist.
The exact coordinates are not repeated in this guide. Copy them from the official Actuator reference for your Spring Boot version, linked under references. Then rebuild the project so the change is picked up.
Why: Actuator provides both the endpoints and the dependency management and auto-configuration for Micrometer.
Step 2 of 11: Start the app and request the health endpoint
Start your application the way you normally do. Then send one request to the health endpoint from a second terminal. Replace YOUR_PORT with the port your server listens on.
Why: this proves that the endpoint is available, which means access is permitted and the endpoint is exposed.
curl -i http://localhost:YOUR_PORT/actuator/health
Step 3 of 11: Check what the health response tells you
Read the status line and the body. A successful response means the health endpoint is mapped under the /actuator prefix and returns basic application health information.
If you get a 404, go to the troubleshooting section before you continue. The exact response format is described in the Actuator API documentation, so check it there rather than relying on a copy here.
Why: every later step builds on a reachable Actuator.
Step 4 of 11: Choose an access policy for your endpoints
Decide whether endpoints are opt-out or opt-in. The default is opt-out: everything except shutdown and heapdump is unrestricted.
For a safer start, make access opt-in. Set management.endpoints.access.default to none, then turn on only what you need with management.endpoint.<id>.access. The example below denies everything, then opens health and metrics as read-only.
Why: inaccessible endpoints are removed entirely from the application context, so a closed endpoint cannot be reached at all.
The access values shown in the Actuator reference are none, read-only and unrestricted. Read access means read operations only. For request-mapping endpoints it means requests that can handle GET and HEAD.
management:
  endpoints:
    access:
      default: none
  endpoint:
    health:
      access: read-only
    metrics:
      access: read-only
Step 5 of 11: Set an application-wide ceiling on access
Optionally add management.endpoints.access.max-permitted to cap what any endpoint may do. The value read-only allows only read access. The value none makes all endpoints inaccessible.
Why: this property takes precedence over the default access and over an individual endpoint's access level, so one line protects you from a later, more permissive per-endpoint setting.
Keep the shutdown endpoint closed unless you truly need it. It is disabled by default, only works with jar packaging and lets the application be gracefully shut down. To allow it you would set management.endpoint.shutdown.access=unrestricted.
management:
  endpoints:
    access:
      max-permitted: read-only
Step 6 of 11: Confirm the exposure setting for HTTP
Check that the endpoints you opened are also exposed over HTTP. Access and exposure are two separate switches. To change only the technologies over which an endpoint is exposed, the Actuator reference tells you to use the include and exclude properties.
The full property names are on the official endpoints page, so open it and copy them from there for your Spring Boot version.
Why: an endpoint with permitted access that is not exposed is still not available.
Step 7 of 11: Add the Micrometer Prometheus registry
Add the Prometheus registry to your build. A dependency on micrometer-registry-{system} in your runtime classpath is enough for Spring Boot to configure the registry.
Do not set a version. Spring Boot's dependency management supplies it. If you use Micrometer's BOM directly instead, declare it once and leave the version off this dependency too.
Why: Spring Boot auto-configures a composite MeterRegistry and adds a registry for each supported implementation it finds on the classpath.
The endpoint that exposes metrics in a Prometheus-scrapable format needs this dependency. Its ID is listed on the official endpoints page. Reach it the same way as the others, with /actuator/ plus the ID.
<dependency>
    <groupId>io.micrometer</groupId>
    <artifactId>micrometer-registry-prometheus</artifactId>
</dependency>
implementation 'io.micrometer:micrometer-registry-prometheus'
Step 8 of 11: Add a common tag to every metric
Create a configuration class with a MeterRegistryCustomizer bean. It applies the tag region to every meter, so you can slice data by that dimension later. Change us-east-1 to your own value.
Why: registry customizers run before any meters are registered with the registry, so the tag reaches all of them. A meter is identified by its name and its tags, and tags let you drill down on a named metric.
package com.example.demo;

import io.micrometer.core.instrument.MeterRegistry;
import org.springframework.boot.micrometer.metrics.autoconfigure.MeterRegistryCustomizer;
import org.springframework.context.annotation.Bean;
import org.springframework.context.annotation.Configuration;

@Configuration(proxyBeanMethods = false)
public class MyMeterRegistryConfiguration {

    @Bean
    public MeterRegistryCustomizer<MeterRegistry> metricsCommonTags() {
        return (registry) -> registry.config().commonTags("region", "us-east-1");
    }

}
Step 9 of 11: Record a custom counter
Add a service that registers a Counter on the injected MeterRegistry. Call feature() from your own code wherever the event you want to count happens.
Why: a counter reports a single metric, a count, and it can only go up by a positive amount. The counter is stored in a field, which avoids looking it up by name and tags on every use.
Use a counter only for things you cannot time. A Timer or a DistributionSummary already publishes a count of events, so you do not need a separate counter for code you time.
package com.example.demo;

import io.micrometer.core.instrument.Counter;
import io.micrometer.core.instrument.MeterRegistry;
import org.springframework.stereotype.Service;

@Service
public class FeatureService {

    private final Counter featureCounter;

    public FeatureService(MeterRegistry registry) {
        this.featureCounter = Counter.builder("feature")
                .description("Number of times the feature was used")
                .tags("region", "test")
                .register(registry);
    }

    public void feature() {
        featureCounter.increment();
    }

}
Step 10 of 11: Restart the app and list the metrics
Restart the application so the new beans load. Then request the metrics endpoint.
Why: the metrics endpoint shows the metrics the application has recorded, which lets you diagnose what is being collected. Look for the name feature in the response.
curl -i http://localhost:YOUR_PORT/actuator/metrics
Step 11 of 11: Turn registries off when you do not want an export
Disable a registry through configuration if its library is on the classpath but you do not want it active. The setting below disables all registries unless a registry-specific property says otherwise.
Why: most registries share these common features, so you can keep a dependency in the build and still control the export per environment.
To disable one registry only, use its own property. The Actuator reference shows management.datadog.metrics.export.enabled=false as the pattern for Datadog.
management:
  defaults:
    metrics:
      export:
        enabled: false
Expected result
A request to /actuator/health returns a successful HTTP response with basic application health information. A request to /actuator/metrics returns a response that lists the metrics the application has recorded, including the name feature once the counter is registered. If you set max-permitted to none, or the default access to none without opening an endpoint, the same requests return an error because inaccessible endpoints are removed from the application context. The exact response bodies are documented in the Actuator API documentation.
Troubleshooting
| Problem | Likely cause | Fix |
|---|---|---|
| /actuator/health returns 404 | The endpoint is not available: Actuator is missing from the build, access is not permitted, or the endpoint is not exposed over HTTP. An endpoint is available only when it is both permitted and exposed. | Confirm the Actuator dependency is in the build. Check that management.endpoint.health.access is not none and that management.endpoints.access.max-permitted does not block it. Then check the HTTP exposure setting on the official endpoints page. |
| An endpoint you opened is still missing after you set its access property | management.endpoints.access.max-permitted takes precedence over default access and over an individual endpoint's access level. | Raise or remove max-permitted, then restart the application. |
| The shutdown endpoint does not respond | It is disabled by default and only works when you use jar packaging. | Set management.endpoint.shutdown.access=unrestricted only if you really need it, and run the app from a jar. |
| The Prometheus endpoint is not present | The endpoint requires the micrometer-registry-prometheus dependency, and it only exists if it is available (permitted and exposed). | Add micrometer-registry-prometheus to the runtime classpath, check the endpoint ID on the official endpoints page, and open access and exposure for it. |
| Your custom metric is not in the metrics list | The meter was never registered, for example because the class that creates it is not a Spring bean, or all registries are disabled with management.defaults.metrics.export.enabled=false. | Make sure the service is a Spring bean that receives the MeterRegistry. Check the export settings. Restart the application and request /actuator/metrics again. |
| Metrics recorded on a CompositeMeterRegistry have no effect | Recordings have no effect until there is a non-composite registry in the composite. Meters recorded before a registry was added are not reflected in it. | Add your registries and filters first, then register meters. In Spring Boot, use MeterRegistryCustomizer beans so configuration happens before meters are registered. |
Frequently asked questions
What URL does the Spring Boot health check use?
By default the health endpoint is mapped to /actuator/health. The endpoint ID plus the /actuator prefix forms the URL for HTTP.
What makes an Actuator endpoint available?
Access to it must be permitted and it must be exposed. Built-in endpoints are auto-configured only when they are available.
Which endpoints are restricted by default?
Access to all endpoints is unrestricted except shutdown and heapdump.
How do I make endpoint access opt-in?
Set management.endpoints.access.default to none. Then set management.endpoint.<id>.access for each endpoint you want, for example read-only.
Do I need to configure a MeterRegistry myself?
No. Spring Boot auto-configures a composite MeterRegistry and adds a registry for each supported implementation it finds on the classpath. You can inject the MeterRegistry into your own beans.
Do I need a version for micrometer-registry-prometheus?
Not when a BOM or your framework's dependency management defines it. Spring Boot Actuator provides dependency management for Micrometer.
Can I try metrics without a monitoring system?
Yes. Micrometer includes a SimpleMeterRegistry that holds the latest value of each meter in memory and exports nothing. It is autowired for you in Spring-based applications.
How do I secure the endpoints with a login?
This guide covers endpoint access and exposure only. Check the official Spring Boot documentation for authentication of HTTP endpoints.
References
From Grokem: https://www.grokem.com/programming/web-development/backend/spring-boot-actuator-health-checks-and-micrometer-metrics-for-beginners